Crypto doesn’t move in straight lines. It surges, it crashes, and it punishes anyone trading on hype instead of evidence.
If you’re here, you’re likely trying to figure out what the market is about to do next—and how to position yourself before it does. The problem? Volatility makes every move feel urgent, and gut feelings often lead to costly mistakes.
This guide breaks down the crypto bull and bear indicators that actually matter. Not just what they are—but how to interpret them in real time. Drawing on years of analyzing blockchain data and token performance trends, we’ve filtered out the noise so you can read the signals with clarity and make smarter, more disciplined decisions.
On-Chain Analysis: The Digital Footprints of Whales
If technical charts are the weather report, on-chain analysis is the satellite view. It examines data recorded directly on a blockchain—transaction volumes, wallet balances, and address activity—to assess network health in real time. Because blockchains are public ledgers, this data is transparent and verifiable (no corporate earnings call required).
Some critics argue on-chain metrics are overrated—price, they say, already reflects everything. That’s partially true in highly efficient markets. But crypto isn’t Wall Street circa 1998. It’s more like the early internet—raw, transparent, and behavior-driven. Watching wallets move funds can offer clues before headlines catch up.
Key Indicator: Net Exchange Flow
This tracks whether coins are moving into or out of exchanges.
- Bullish Signal: Large, sustained outflows of BTC or ETH from exchanges to private wallets suggest accumulation for long-term holding. Investors typically move assets off exchanges when they don’t plan to sell soon (pro tip: verify flows across multiple exchanges to avoid false signals).
- Bearish Signal: Significant inflows to exchanges often indicate holders are preparing to sell, increasing short-term supply pressure.
Key Indicator: Active Addresses
This measures the number of unique addresses transacting.
- Bullish Signal: A steady rise signals growing adoption and real network usage—similar to rising daily users on a tech platform.
- Bearish Signal: A drop or stagnation suggests fading interest.
Key Indicator: Transaction Value
This looks at the size of transfers.
- Bullish Signal: Increasing large transactions from “whales” can reflect institutional conviction (think big chess pieces moving).
- Bearish Signal: Declining large transfers replaced by smaller retail trades can signal late-cycle enthusiasm.
Building Your Strategy: Combining Indicators for a Clearer Picture

The Confluence Principle in Action
If you’ve spent any time in crypto, you’ve probably heard someone say, “Just follow the chart.” Others insist on tracking wallets or scrolling sentiment dashboards all day. The truth sits somewhere in between.
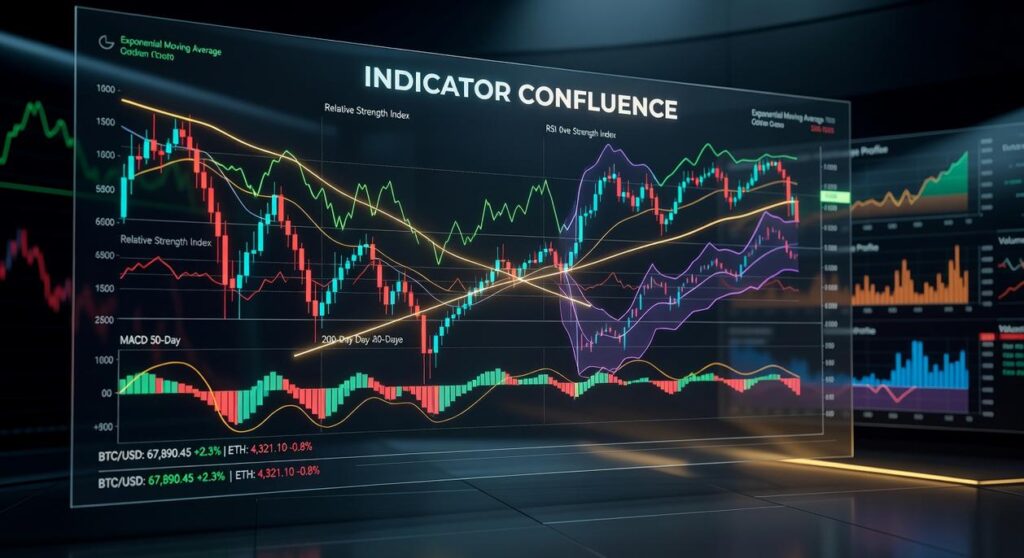
The Confluence Principle means the strongest signals appear when multiple indicators—on-chain data (blockchain transaction metrics like exchange flows), technical analysis (TA, or chart-based price patterns), and sentiment (market mood indicators)—align. In other words, never rely on a single indicator.
For example, imagine a bullish setup: BTC is flowing out of exchanges (on-chain supply tightening), a Golden Cross appears on the daily chart (when the 50-day moving average crosses above the 200-day), and the Fear & Greed Index climbs from Fear to Neutral. That alignment doesn’t guarantee upside—but it stacks probabilities in your favor.
Skeptics argue this is overcomplicating things. Why not just dollar-cost average and ignore the noise? Fair point. Long-term strategies work. However, if you’re actively allocating capital, context matters.
Now flip it. ETH floods into exchanges, RSI shows bearish divergence on the weekly chart (price rises while momentum weakens), and funding rates spike to extreme highs. That’s confluence on the downside.
This framework becomes even more powerful in emerging ecosystems, where early on-chain signals can reveal shifts before headlines catch up.
From Reactive Trader to Proactive Analyst
The difference between reacting to the market and anticipating it comes down to one thing: evidence.
You now have a complete toolkit of on-chain data, technical structure, and sentiment-based signals to spot crypto bull and bear indicators before they fully play out. Instead of relying on headlines or social media hype, you can read what the market is actually telling you.
Volatility isn’t the enemy. Uncertainty is.
By moving beyond guesswork and adopting a data-driven approach, you reduce emotional decisions and increase strategic clarity. No single metric can give you the full picture. But when on-chain flows, price action, and sentiment align, they create a far more reliable signal than any standalone indicator ever could.
That’s how proactive analysts think.
Now it’s your move.
Start simple. Track one key indicator from each category for a single asset you follow. Build a small dashboard. Watch how the signals interact during breakouts, pullbacks, and consolidations. Patterns will begin to reveal themselves.
If you’re tired of reacting late and second-guessing every trade, it’s time to upgrade your process. Use structured crypto bull and bear indicators, build your system, and start making decisions with confidence instead of hope.
The market rewards preparation. Begin tracking today.